Contamination of surface waters with fecal pathogens is a global human health concern. Concentrations of predominantly non-pathogenic fecal indicator bacteria – Escherichia coli (E. coli) and fecal coliforms – are regulatory proxies (standards) used to safeguard public health from pathogens of concern – Cryptosporidium spp., Giardia spp., and E. coli O157:H7.
There is substantial variation in microbial water quality standards recommended between federal, state, and regional water quality agencies. For example, some agencies recommend E. coli and other recommend fecal coliform standards. Some agencies recommend one concentration while others recommend another. This cross agency variation generates substantially different perceptions of microbial water quality conditions depending upon the standard employed at your ZIP code.
Contemporary research demonstrates that E. coli is superior to fecal coliforms as a proxy for fecal pollution from warm-blooded mammals. This is due to the “fecal” coliform test’s chronic detection of non-fecal, environmental coliform bacteria. “Fecal” coliforms are not well correlated to fecal pollution, and these false-positive outcomes create erroneously high estimates of health risk compared to E. coli (e.g., Edberg et al. 2000; Doyle and Erikson 2006; and Odonkor and Ampofo 2013).
This, and other issues with fecal coliform, has led both the U.S. Environmental Protection Agency and the California State Water Resources Control Board to recommend E. coli based standards to safeguard human health in fresh water systems. This is a move supported by the scientific community.
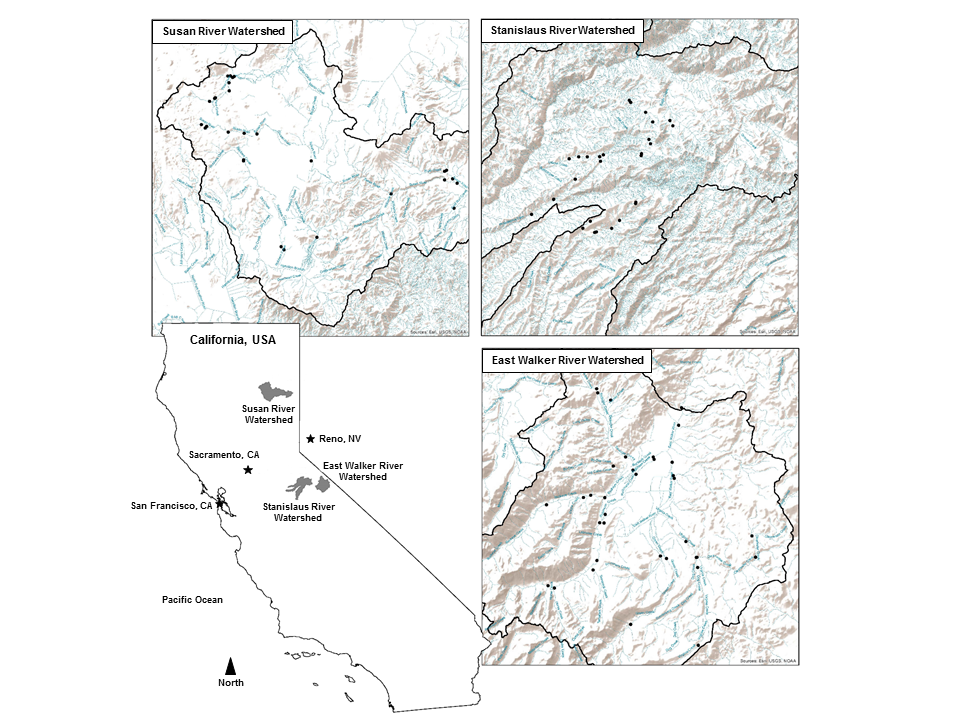
To quantify the variation generated by various current microbial water quality standards in California, we conducted a survey of fecal coliform and E. coli concentrations in surface waters across 77 sample sites in the upper reaches of three mixed land use rural watersheds traversing the northern Sierra Nevada and southern Cascade regions of California (Figure 1).
Six microbial water quality standards were relevant to the study area at the time of the study. Results in Table 1 and Table 2 demonstrate the potential for substantial discord, and policy-driven confusion, in assessments of microbial conditions using fecal coliform compared to E. coli-based water quality standards as indicators of fecal pollution by warm-blooded mammals.
Our results demonstrate that policies reliant on antiquated fecal coliform-based water quality standards overestimate potential fecal contamination by as much as four orders of magnitude in this landscape.
Such policies:
- Hinder the identification of the most likely fecal pollution sources and thus the successful targeting of mitigation practices to address them.
- Misrepresent actual microbial water quality conditions to stakeholders, resources managers, and policy makers, hindering science-based decision making.
We strongly recommend the application of E. coli based standards to 1) guide water quality improvement; and 2) safeguard human health in these vast landscapes.
Derose, K.L., L.M. Roche, D.F. Lile, D.J. Eastburn, and K.W. Tate. Microbial Water Quality Conditions Associated with Livestock Grazing, Recreation, and Rural Residences in Mixed Use Landscapes. Sustainability 2020, 12, 5207.
The complete findings from this study can be viewed here.
Literature Cited
Edberg, S.C.; Rice, E.W.; Karlin, R.J.; Allen, M.J. Escherichia coli: The best biological drinking water indicator for public health protection. J. Appl. Microbiol. Symp. Suppl. 2000, 88., 106S-116S.
Doyle, M.P.; Erickson, M.C. Closing the door on the fecal coliform assay. Microbe 2006, 1, 162–163.
Odonkor, S.T.; Ampofo, J.K. Escherichia coli as an indicator of bacteriological quality of water: An overview. Microbiol. Res. (Pavia) 2013, 4, e2.
SEE TABLES BELOW
Table 1. Exceedances based upon the study period geomean concentration (cfu/100 mL) standard for E. coli and fecal coliform (FC) at each sample site by specific fecal sources (recreation, grazing, and rural residences) across the entire summer study period (July through September of 2016). The geomean is calculated by (1) transforming sample concentrations by log10, (2) calculating the mean of those transformed concentrations, and then (3) raising the transformed mean by the power of 10.
| Percent of Sample Sites | ||||
| Sites | E. coli > 100 | FC > 20 | FC > 200 | |
| Overall | 77 | 14 | 61 | 53 |
| Recreation | 40 | 8 | 53 | 45 |
| Grazing | 31 | 10 | 65 | 55 |
| Residences | 6 | 83 | 100 | 100 |
Table 2. Exceedances based upon the study period statistical threshold value (STV) concentration standard that no more than 10% of individual grab samples exceeding benchmark concentrations (cfu/100 mL) for E. coli and fecal coliform (FC) at each site by specific fecal sources (recreation, grazing, and rural residences) across the entire summer study period (July through September of 2016).
| Percent of Sample Sites | ||||
| Sites | E. coli > 320 | FC > 40 | FC > 400 | |
| Overall | 77 | 13 | 83 | 25 |
| Recreation | 40 | 5 | 80 | 15 |
| Grazing | 31 | 16 | 84 | 29 |
| Residences | 6 | 50 | 100 | 67 |