Preface
This brief summarizes an analysis of Water Quality impairments in California for which livestock grazing has been identified as one possible source of impairment. The data for this analysis was sourced from the 2012 California State Water Resources Control Board Integrated Report (Clean Water Act Section 303(d) List / 305(b) Report). The complete list of water quality impairments in this report was filtered for "grazing" related impairments under the Potential Sources column. These impairments were then analyzed by the categories Region Name, Water Body, Pollutant, Pollutant Type, and TMDL Compliance (TMDL Requirement Status). Additional analysis was conducted by utilizing the "show only impaired ("303(d)-listed”) waters" option of the State Water Quality Board’s interactive map. This allows access to the lines of evidence supporting each impairment designation.
Key Points
- A reduction in total number of listings from 2010: From 7,294 (2010) to 4,851 (2012)
- A reduction in number of listings with grazing as a potential source from 2010: From 324 (2010) to 42 (2012)
- 16 Listings for Grazing (38%) as a potential source have no available data (samples or exceedances) listed online. The listing is supported by a LOE (line of evidence) Placeholder for data prior to 2006.
- TMDL Compliance Status
- 93% addressed by USEPA Approved TMDL or actions other than a TMDL such as a waiver.
- 7% not addressed.
- Some water bodies listed multiple times due to multiple “sources” (e.g., "Range grazing" and "Pasture grazing")
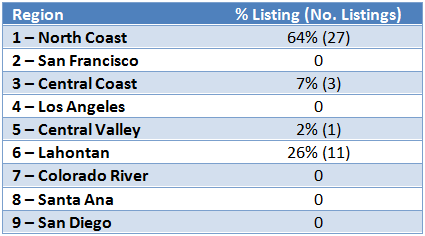
Number of Grazing Impairments by Region
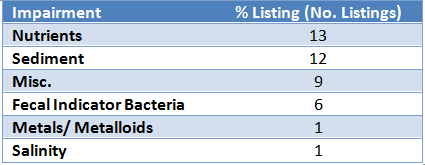
Grazing Impairments by Pollutant
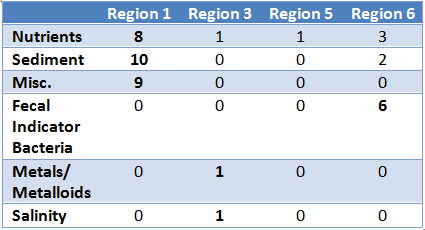
Grazing Impairments by Pollutant and Region
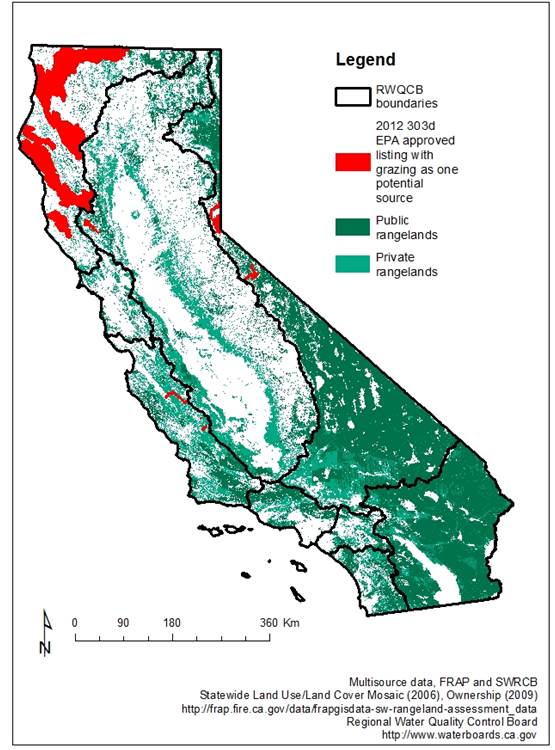
Grazing as a Potential Source
All Water Quality Impairments
Summary
From 2010 to 2012 the total number of listings decreased from 7,294 to 4,851 (a 33% decrease) and the grazing related sources saw a greater decrease from 324 to 42 (an 87% decrease). Grazing as a percentage of total impairments decreased from 4% to 0.9% from 2010 to 2012. Many of the changes involved a consolidation of multiple listings for the same or similar sources (e.g "Range grazing" and "Pasture grazing") however there was a complete delisting for the pollutants “Pesticides” and “Toxicity” from 2010 to 2012 as well as pH and most instances of Water Temperature (both listed under Miscellaneous Pollutant type). The distribution of water quality impairments across the state decreased; the most dramatic delisting is a 99% decrease (from 235 to 3) in the Central Coast Region. "Grazing" related impairments have also decreased across the North Coast, Central Valley, and Lahontan regions. The other regions remained at zero.